LangGraph Agent Tracing With OpenTelemetry
Standardized spans make agent failures visible where service metrics fall silent.
A single user request to a LangGraph agent sets off a cascade of internal operations: LLM calls, tool invocations, memory reads, planning decisions, retries. That data confirms a service responded. It says nothing about whether the agent picked the right tool, passed valid arguments to it, or stayed anywhere near the plan it started with.
A dashboard built on service-boundary metrics can show green across the board, but the agent can still get every answer wrong. The failure signal in an agent run rarely looks like an HTTP error or a timeout. Standard monitoring has no vocabulary for any of this, because it was built to answer a different question than the one agent operators need answered.
What the OpenTelemetry GenAI semantic conventions define
The OpenTelemetry GenAI semantic conventions solve a specific problem: they give every LLM call, tool invocation, and agent step a standardized span schema, so a team instruments once and can ship traces to any backend without rebuilding the instrumentation layer for each one. The GenAI spec exists because the field needed a dedicated schema for prompts, completions, token counts, tool parameters, and multi-step reasoning, none of which fit the request/response shape that older conventions assumed.
The spec spans six layers: client-level spans for individual model calls, agent and workflow spans for multi-step execution, conventions for MCP tool calls, events for content capture, metrics, and quality evaluation. A few span types do most of the work. Every LLM call generates a span with gen_ai.operation.name set to chat, text_completion, or generate_content, and because the model runs on a remote service outside the calling process, the span kind is CLIENT.
Two histogram metrics form the floor for any production deployment: gen_ai.client.operation.duration, measured in seconds, and gen_ai.client.token.usage, which tracks token consumption split by token type. Without those two signals, there's no way to reason about what an agent costs to run or how fast it responds under load. Attribute and metric names come from the opentelemetry-semantic-conventions package rather than from hand-typed string literals, and that choice has a concrete payoff: when a name changes upstream, importing from the package turns the break into an import error caught in CI, instead of a silent mislabeling that corrupts telemetry without anyone noticing.
How a LangGraph run maps onto a span tree
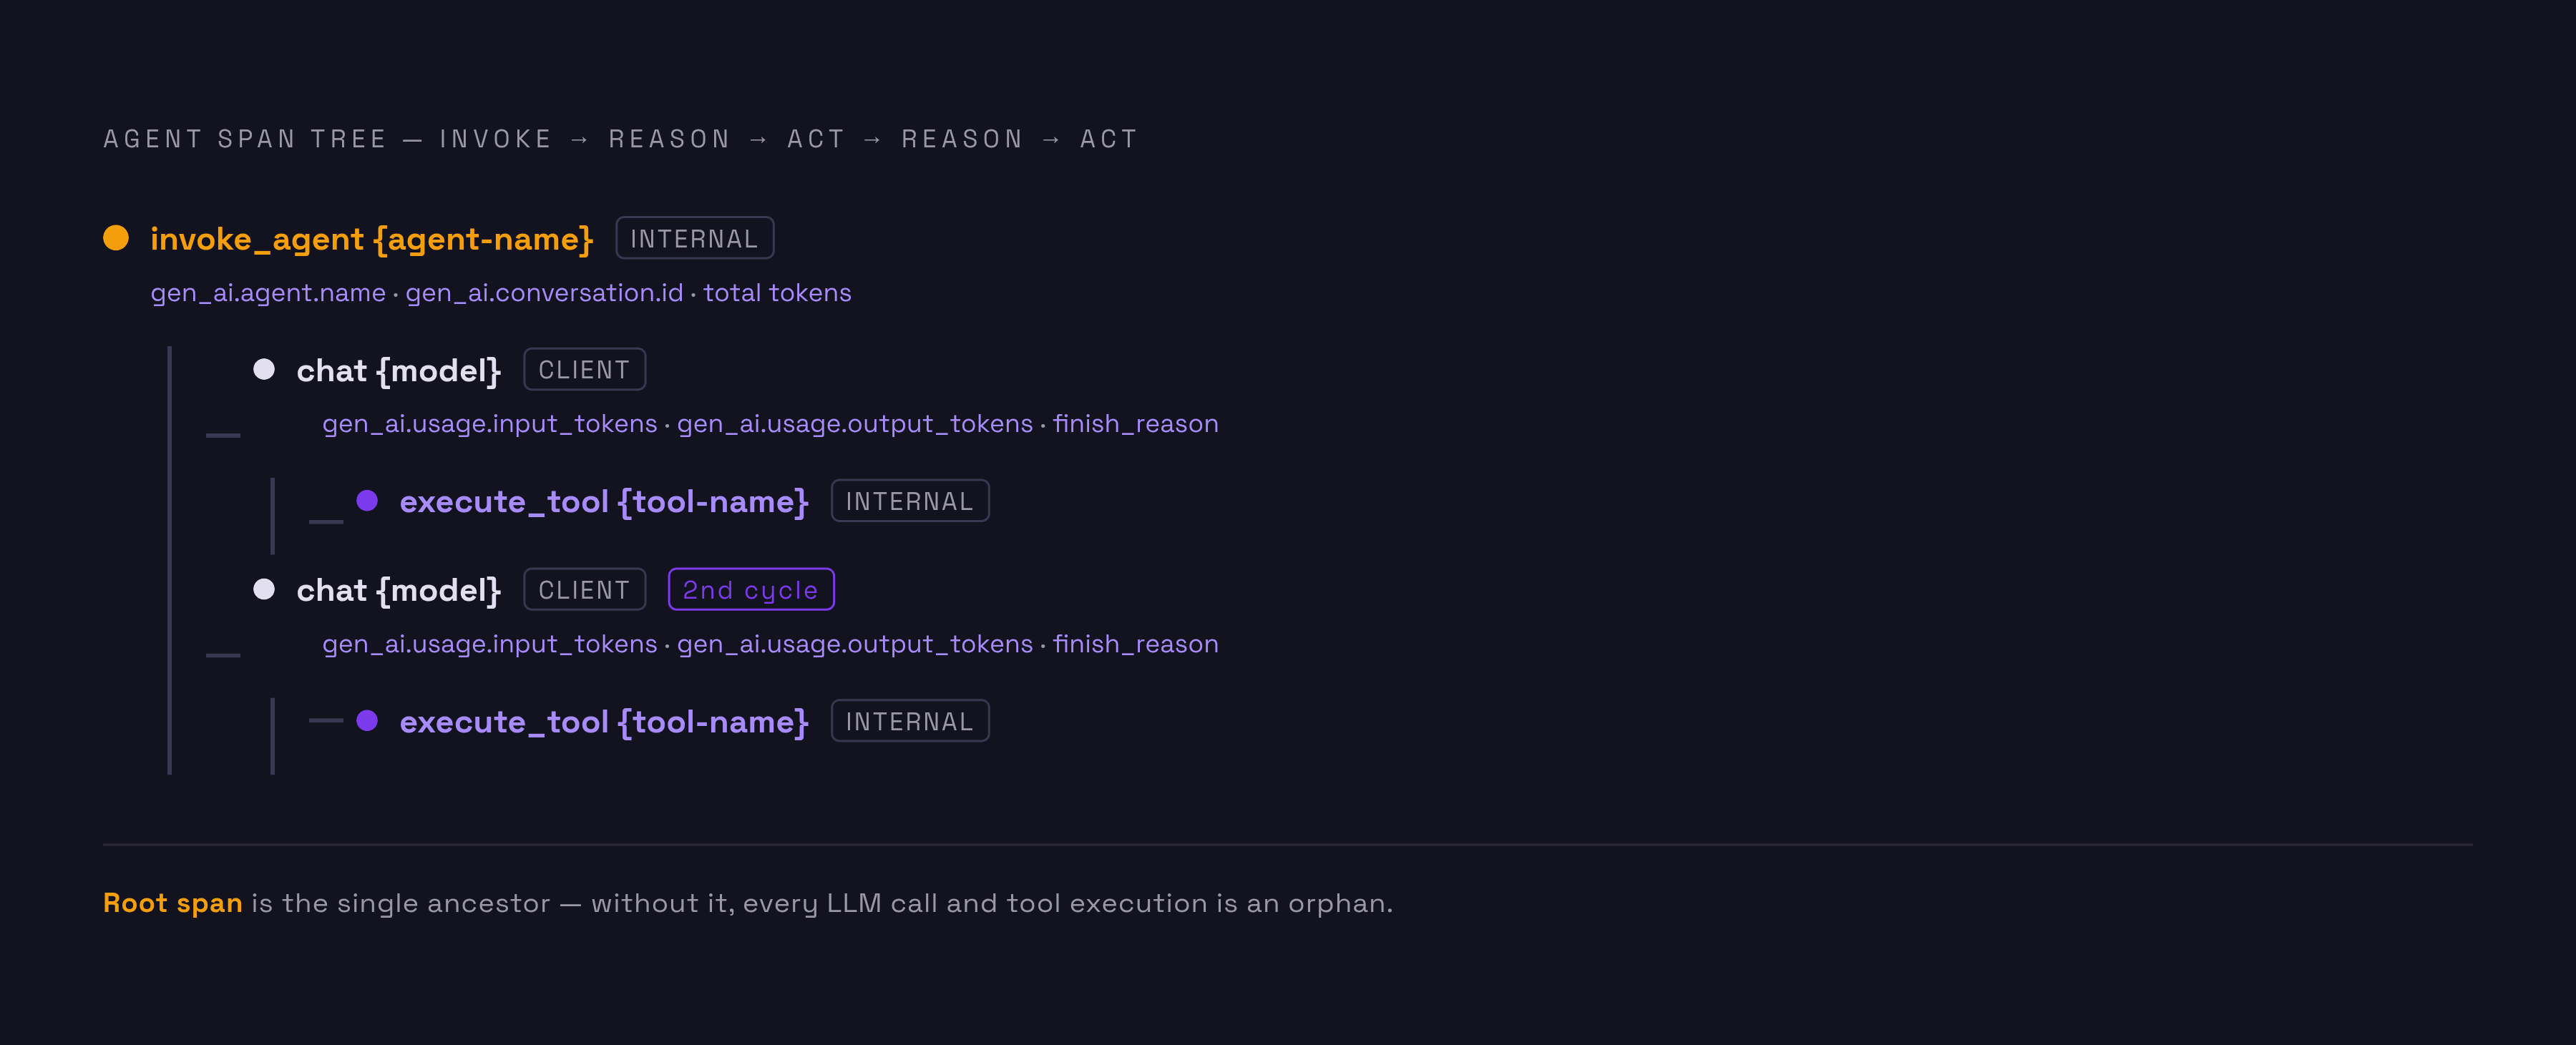
You open an agent span around graph.invoke, and it becomes the root of the trace, so every LLM call and tool execution inside the graph attaches underneath it as a child span. The trace mirrors the graph's actual execution path as a tree of nested spans. A single user turn in a multi-step LangGraph agent can produce far more spans than a typical REST API request generates for a comparable amount of work: one reasoning cycle alone can produce an LLM span, one or more tool spans beneath it, and any retry spans the tool needed.
A representative run, drawn from the agent-tracing-demo reference implementation, builds a tree that looks like this:
invoke_agent {agent-name}              [root, INTERNAL]
gen_ai.agent.name, gen_ai.conversation.id, total token usage
└── chat {model}                       [CLIENT]

gen_ai.usage.*, gen_ai.response.finish_reasons
└── execute_tool {tool-name}       [INTERNAL]

└── chat {model}                       [CLIENT, second reasoning cycle]
└── execute_tool {tool-name}       [INTERNAL]
The root span is invoke_agent {agent-name}, an INTERNAL span, and it carries the agent's name, the conversation ID, and total token usage across the whole run. The full tree shows you the entire reasoning loop, not just its final output.
Span names need to stay low-cardinality: chat {model} and execute_tool {tool}, never a span name carrying prompt content or raw user input, because span names get indexed and displayed everywhere a trace is viewed. The two mandatory metrics add up across every child span in the tree. In the demo run, gen_ai.client.operation.duration collects a count of 3 and a duration sum across three LLM calls, and gen_ai.client.token.usage reports input and output totals separately. Those two numbers answer what a model is costing per day without anyone manually summing spans by hand.
Streaming doesn't change the shape of the tree. Failed tool calls don't fail the run, either: the error goes back to the model as the tool's result, the tool span records its duration tagged with error.type and zero tokens, and the parent agent span keeps running. The failure gets its own permanent record in the trace, but the agent keeps working the problem.
The context propagation problem at LangGraph node boundaries
Trace context crossing a LangGraph node boundary breaks silently the moment graph execution moves to another thread without explicit context propagation. An orphaned span with no link back to the root agent span results, and nothing in the system raises an alarm when it happens. This is the first thing that breaks when a LangGraph graph uses async execution, parallel branches, or background workers: a span opened in one node has no automatic relationship to a span opened in the next, unless something has explicitly carried the context across.
The agent-tracing-demo repository includes a test built specifically for this failure, because cross-node context is "the first thing to break if graph execution moves to another thread without context." The fix is straightforward to state and easy to skip in practice: open the agent span around graph.invoke, then pass the OTel context explicitly into any async or parallel branch rather than trusting implicit thread-local propagation inside a multi-threaded graph. For HTTP-based agent delegation, where one agent calls another over the network, the outgoing request needs a W3C traceparent header, and the receiving worker needs to extract it so its own spans land under the same root trace.
In-process node transitions inside a single-threaded graph don't need any of this. The cheapest way to catch the failure is a test that asserts parent-child links across node boundaries: if the agent span isn't the parent of the first chat span, context propagation has failed, and finding that in CI costs far less than reconstructing a shattered trace after a production incident.
Setting up instrumentation: auto-instrumentation libraries and the manual fallback
Auto-instrumentation libraries can cut initial setup down to two or three lines of code, but what matters for getting useful traces out the other end is understanding what those libraries emit and where their coverage stops.
The auto-instrumentation path looks like this in practice:
# Install: pip install openinference-instrumentation-
from openinference.instrumentation. import LangChainInstrumentor

LangChainInstrumentor().instrument()
# Point the OTel exporter at your collector before graph.invoke runs
The instrumentor hooks into the framework's internals and starts producing spans as soon as it's initialized, ahead of the first graph invocation.
from opentelemetry import trace
from opentelemetry.semconv.attributes import gen_ai_attributes as genai

tracer = trace.get_tracer(__name__)

with tracer.start_as_current_span("invoke_agent my-agent") as span:
span.set_attribute(genai.GEN_AI_AGENT_NAME, "my-agent")
try:
result = graph.invoke(state)
finally:
span.end()
One design constraint overrides everything else here: OTel setup has to be non-fatal. If credentials are missing or the collector endpoint is unreachable, the instrumentation should log a warning and let the agent keep serving traffic. Without an explicit flush, spans may still export a few seconds later in the background, which is fine for some applications and unacceptable for others where the process might exit before that background export completes.
Handling sensitive data in agent traces before spans leave the process
Microsoft Foundry's guidance on this point is direct: enable content recording during development and debugging, disable it in production to protect sensitive data, and never store secrets, credentials, or tokens inside prompts or tool arguments. The switch controlling this behavior is the environment variable OTEL_INSTRUMENTATION_GENAI_CAPTURE_MESSAGE_CONTENT. When it's set to false, which is the production default, prompts, completions, tool arguments, and tool results don't get recorded in spans. Span structure and the metrics built on top of it stay fully intact; only the content itself is withheld.
Some production debugging needs content capture for a specific failure class. For those cases, you can register a custom span processor ahead of the BatchSpanProcessor to scrub or tokenize sensitive fields before any span leaves the process. The agent-tracing-demo shows this with a telemetry scrubber: it tokenizes a customer's email address consistently across every span it appears in, so correlated queries still work and the raw value never leaves the process boundary.
The tokenization has to stay consistent, which is what makes the approach usable as well as safe. If the same PII field appears in a tool-call span and then again in the chat span that follows (because the model reads the tool's result as part of its next turn), it needs to resolve to the identical token both times, or the two spans stop being linkable in any later query. None of this replaces the more basic rule: secrets and credentials don't belong in prompts or tool arguments to begin with, and the scrubber is a safety net for data that shouldn't have been there, not the primary defense against it. Trace data that does leave the process is still subject to whatever retention and pricing policy the storage backend enforces, so you can adjust sampling rate and retention period as levers alongside the scrubbing policy itself.
Sampling strategy for agent traces at production volume
Production LangGraph agents generate far more telemetry per request than a traditional API does for comparable traffic, so if a sampling strategy treats every trace the same way, it will either blow through the storage budget or quietly bury the failures that matter most.
Some categories of signal belong in every trace, with no exceptions. Tool execution failures sit in a category of their own and should never be sampled away under any reduction scheme, because the storage cost of keeping those spans is far smaller than the cost of missing the failure pattern they reveal.
A staged approach fits most teams' growth curve: trace at full rate through staging and the early weeks of production, then move to head-based sampling at a reduced rate for ordinary traces once conversation volume makes full-rate tracing expensive, while keeping full coverage on every trace that contains an error. P99 latency deserves more attention than P50 in this context. P50 reflects the fast path, often a single LLM call with no tool use at all, while P99 captures the runs that actually stress the system: multi-step reasoning, tool retries, memory lookups, planning loops. These runs are also the ones where the users attempting the hardest tasks get the worst experience, so P99 is the number that tells you what your most demanding users are living through.
Metrics and span attributes that map to real failure modes
Instrumenting a LangGraph agent without knowing what to query afterward produces data that looks complete and localizes nothing. The attributes and metrics worth collecting are the ones chosen because they map directly onto the failure modes agent runs actually produce. A practitioner taxonomy sorts those failures into five categories, each with its own fingerprint in the trace: planning errors, which show up as a wrong tool sequence or an infinite loop; tool errors, which show up as a wrong tool chosen, a fabricated tool call, or a schema rejection; retrieval errors, which show up as the wrong chunk pulled or a hallucinated source cited; reasoning errors, which show up as a confidently wrong answer or a plan that drifted from its original goal; and safety or policy violations.
Three categories of baseline metric cover most of what you need to track reliability, speed, and cost. On cost: cost per successful task and token usage broken down by workflow stage, which gen_ai.client.token.usage answers directly when split by token type and by agent, with no manual span aggregation required.
Specific span attributes do the work of localizing a failure once one of those metrics flags a problem. gen_ai.response.finish_reasons separates a clean stop from a tool-call finish from a length truncation, three failure modes that look identical if all a team has is the final output text but mean entirely different fixes. error.type, recorded on a failed tool span, tags the failure class, so an engineer never has to parse the tool's raw error string by hand. Taken together, these attributes answer the question a service-boundary dashboard can't: not whether the agent service is up, but whether the agent picked the right tool, passed valid arguments, retrieved the right memory entry, and stayed on the plan it started with. Task success itself is a lagging indicator. Tool choice accuracy, argument validity, and termination type are the leading indicators, and they catch a regression before it ever degrades the final answer a user sees.
Connecting agent traces to the rest of your production observability stack
The GenAI conventions are vendor-neutral by design. Agent traces can sit alongside API traces, worker traces, database spans, and alerting pipelines in whatever backend a team already runs. Instrumentation happens once, and the resulting data can export anywhere. In a production environment, an agent shouldn't operate as its own isolated observability island. When agent telemetry can't join the monitoring system the rest of infrastructure already depends on, it creates a blind spot the infra team has no way to act on.
Routing is a matter of configuration, not code. Microsoft Foundry's tracing integration, for agents deployed on Foundry, configures Azure Monitor export automatically and enriches every span with project, agent name, agent version, and agent ID attributes, so the backend can query and display traces without anyone hand-tagging them.
The W3C traceparent header is the bridge that holds cross-service traces together. Framework-specific run inspectors and evaluation dashboards remain useful at development time, and OTel operates as the transport layer that carries the same underlying signal into the production monitoring stack once the agent ships. When a production trace reveals an issue, fixing it inside the workflow engineers already use, whether that's an alert into Slack, a hook into a coding agent, or a surfaced pattern across grouped failures, removes the cost of context-switching into a separate console just to act on what the trace already showed.