Span Design for Multi-Step Agentic Pipelines
Structure agent traces to reveal silent failures before users see them.
Picture a customer-support agent that quotes a refund amount that doesn't match the order record. None of these incidents trips an error code. Each one completes its task, returns a success status, and moves on, while the trace sitting in the observability backend shows nothing out of place. This piece argues that good span design for multi-step agentic pipelines is not about logging more data but about structuring traces so each span records what the agent was trying to do, not only what it did.
Why multi-step agents break in ways traces don't expose
Research spanning over 100,000 agent interactions found that silent failures, defined as deviations from intended behavior under normal conditions with no external trigger, occurred with "alarming regularity" across different architectures, models, and task domains. The operator can take several cycles to notice, and by then the pattern has already repeated enough to appear as a support ticket or a churned account.
The reason for this blind spot sits in how a multi-step agent turn actually executes. The gap between the execution record and the agent's intent is where silent failure lives: the agent returns a success code while fabricating an identifier, promising a refund outside policy, or drifting into behavior that no error monitor was built to catch.
The scale of this problem is not static. Microsoft's AI Red Team, after twelve months of engagements against deployed agentic systems, expanded its failure taxonomy from 27 to 34 modes. That expansion is a signal in itself: the failure surface facing production agents is broader and more structural than anything a conventional error log was designed to reveal.
Span design: what gets recorded versus what needs to be
A conventional span records the mechanics of execution. Taken together, this is a faithful record of what the agent did at that step. It cannot, on its own, answer the question that actually matters in a production incident.
That record cannot say whether the tool call chosen at that step was the right one for the plan the agent was executing. An intent-aware span closes that gap by recording the agent's goal at that step alongside the execution details, so a deviation between the two becomes visible without having to wait for the outcome to fail downstream.
Scale AI's interaction-centric taxonomy makes the cost of this gap explicit in operational terms. Each of those three has a different fix surface, and a trace that only records execution mechanics cannot tell a team which one it is looking at.
That gap between recorded execution and actual intent is why production monitoring platforms built specifically to audit traces against an agent's own instructions, rather than generic error monitors built for request-response systems, have become a necessary layer for catching these deviations before a user ever sees one. Every well-designed span needs to answer what the agent was trying to do at this step, and whether the result in front of us matches it.
The four span types a production agent trace requires
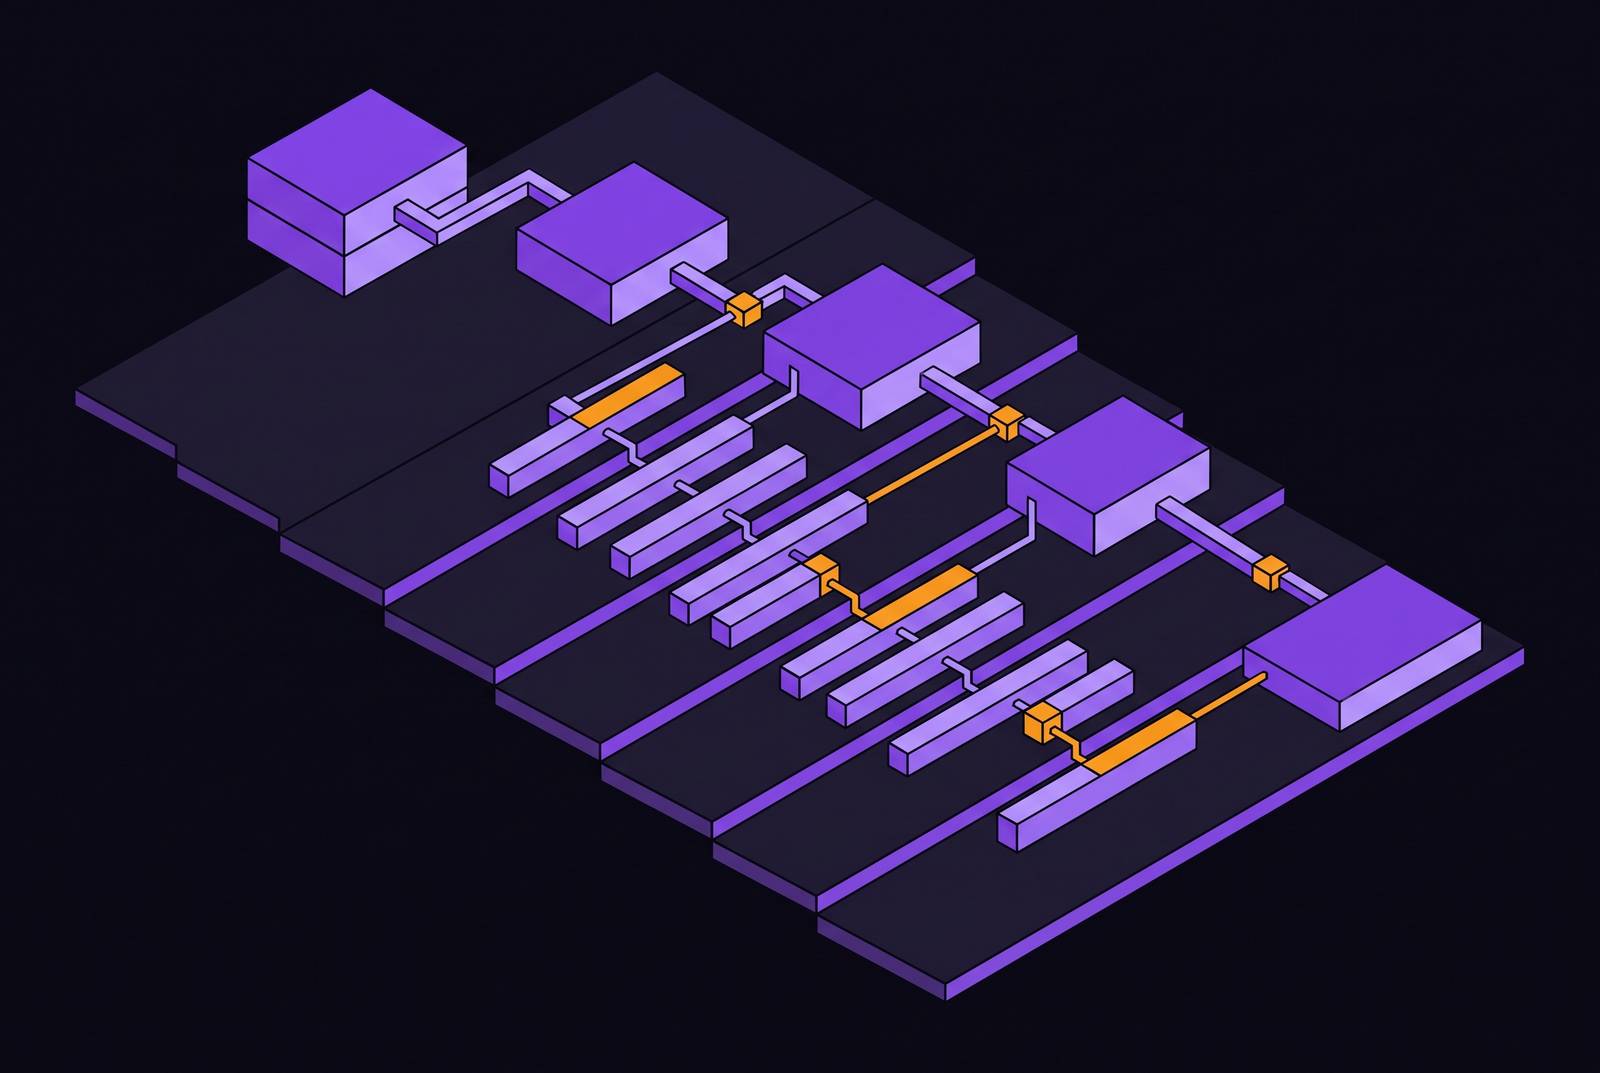
Closing that gap starts with structure. Every production agent trace needs four distinct span types, organized in a deliberate hierarchy, and omitting any one of them creates a blind spot that stays invisible until it reaches a user as a complaint. The four types are LLM calls, tool executions, memory operations, and agent orchestration. Each one maps to a distinct layer of the agent's information flow, and each one has a distinct way of breaking.
The hierarchy that organizes those four types runs three levels deep. Beneath the reasoning spans sit tool call spans, structured as children of whichever reasoning span triggered them, with the result recorded as an attribute on the span itself.
The parent-child relationship between a reasoning span and the tool call it triggers makes intent traceable. The same principle extends past a single agent into multi-agent systems: the handoff payload gets recorded as a span on the parent agent's trace, the receiving agent's run nests under that handoff span, and the same trace ID flows through both sides of the handoff. Losing the trace ID at that boundary is the multi-agent equivalent of a missing reasoning span, and it produces the same kind of blindness.
A standardized tool-calling protocol gives this hierarchy a natural place to plug in.
What each span must carry to make intent legible
With the hierarchy established, the next question is what belongs inside each span. An LLM call span needs the model ID, the prompt version, input and output token counts, latency, and the finish reason. The last two of those are not just performance metrics. They are intent signals: an unexpected finish reason, length instead of stop, for instance, is evidence of a planning deviation, not just a slow response.
A tool call span needs the tool name, sanitized arguments, the tool result status, and a retry count. If those document IDs aren't recorded, a retrieval error that seeds the agent's context with the wrong information stays invisible until the agent has already acted on bad context, and the failure then appears elsewhere in the trace and gets misattributed to a different cause.
One anti-pattern deserves explicit attention: storing full prompt text as a span attribute. The OpenTelemetry GenAI semantic conventions address this by storing content in span events instead, which are not indexed and do not carry the same size constraints or privacy exposure. A team that puts full prompts into attributes is trading a modest convenience for a real liability.
The reasoning span is where the intent signal actually resides. It needs to carry the goal the agent declared for that step and the action it selected in pursuit of that goal, so a reviewer, human or automated, can score whether the action matched the goal without replaying the entire trace from the start. Token count patterns carry a similar early-warning value: anomalies in token counts often appear in agent failure modes before quality metrics degrade, and a span that records token counts at the reasoning level, rather than only at the session level, gives anomaly detection enough granularity to localize the exact step where an agent began improvising.
Mapping the five agent failure categories to span-level signals
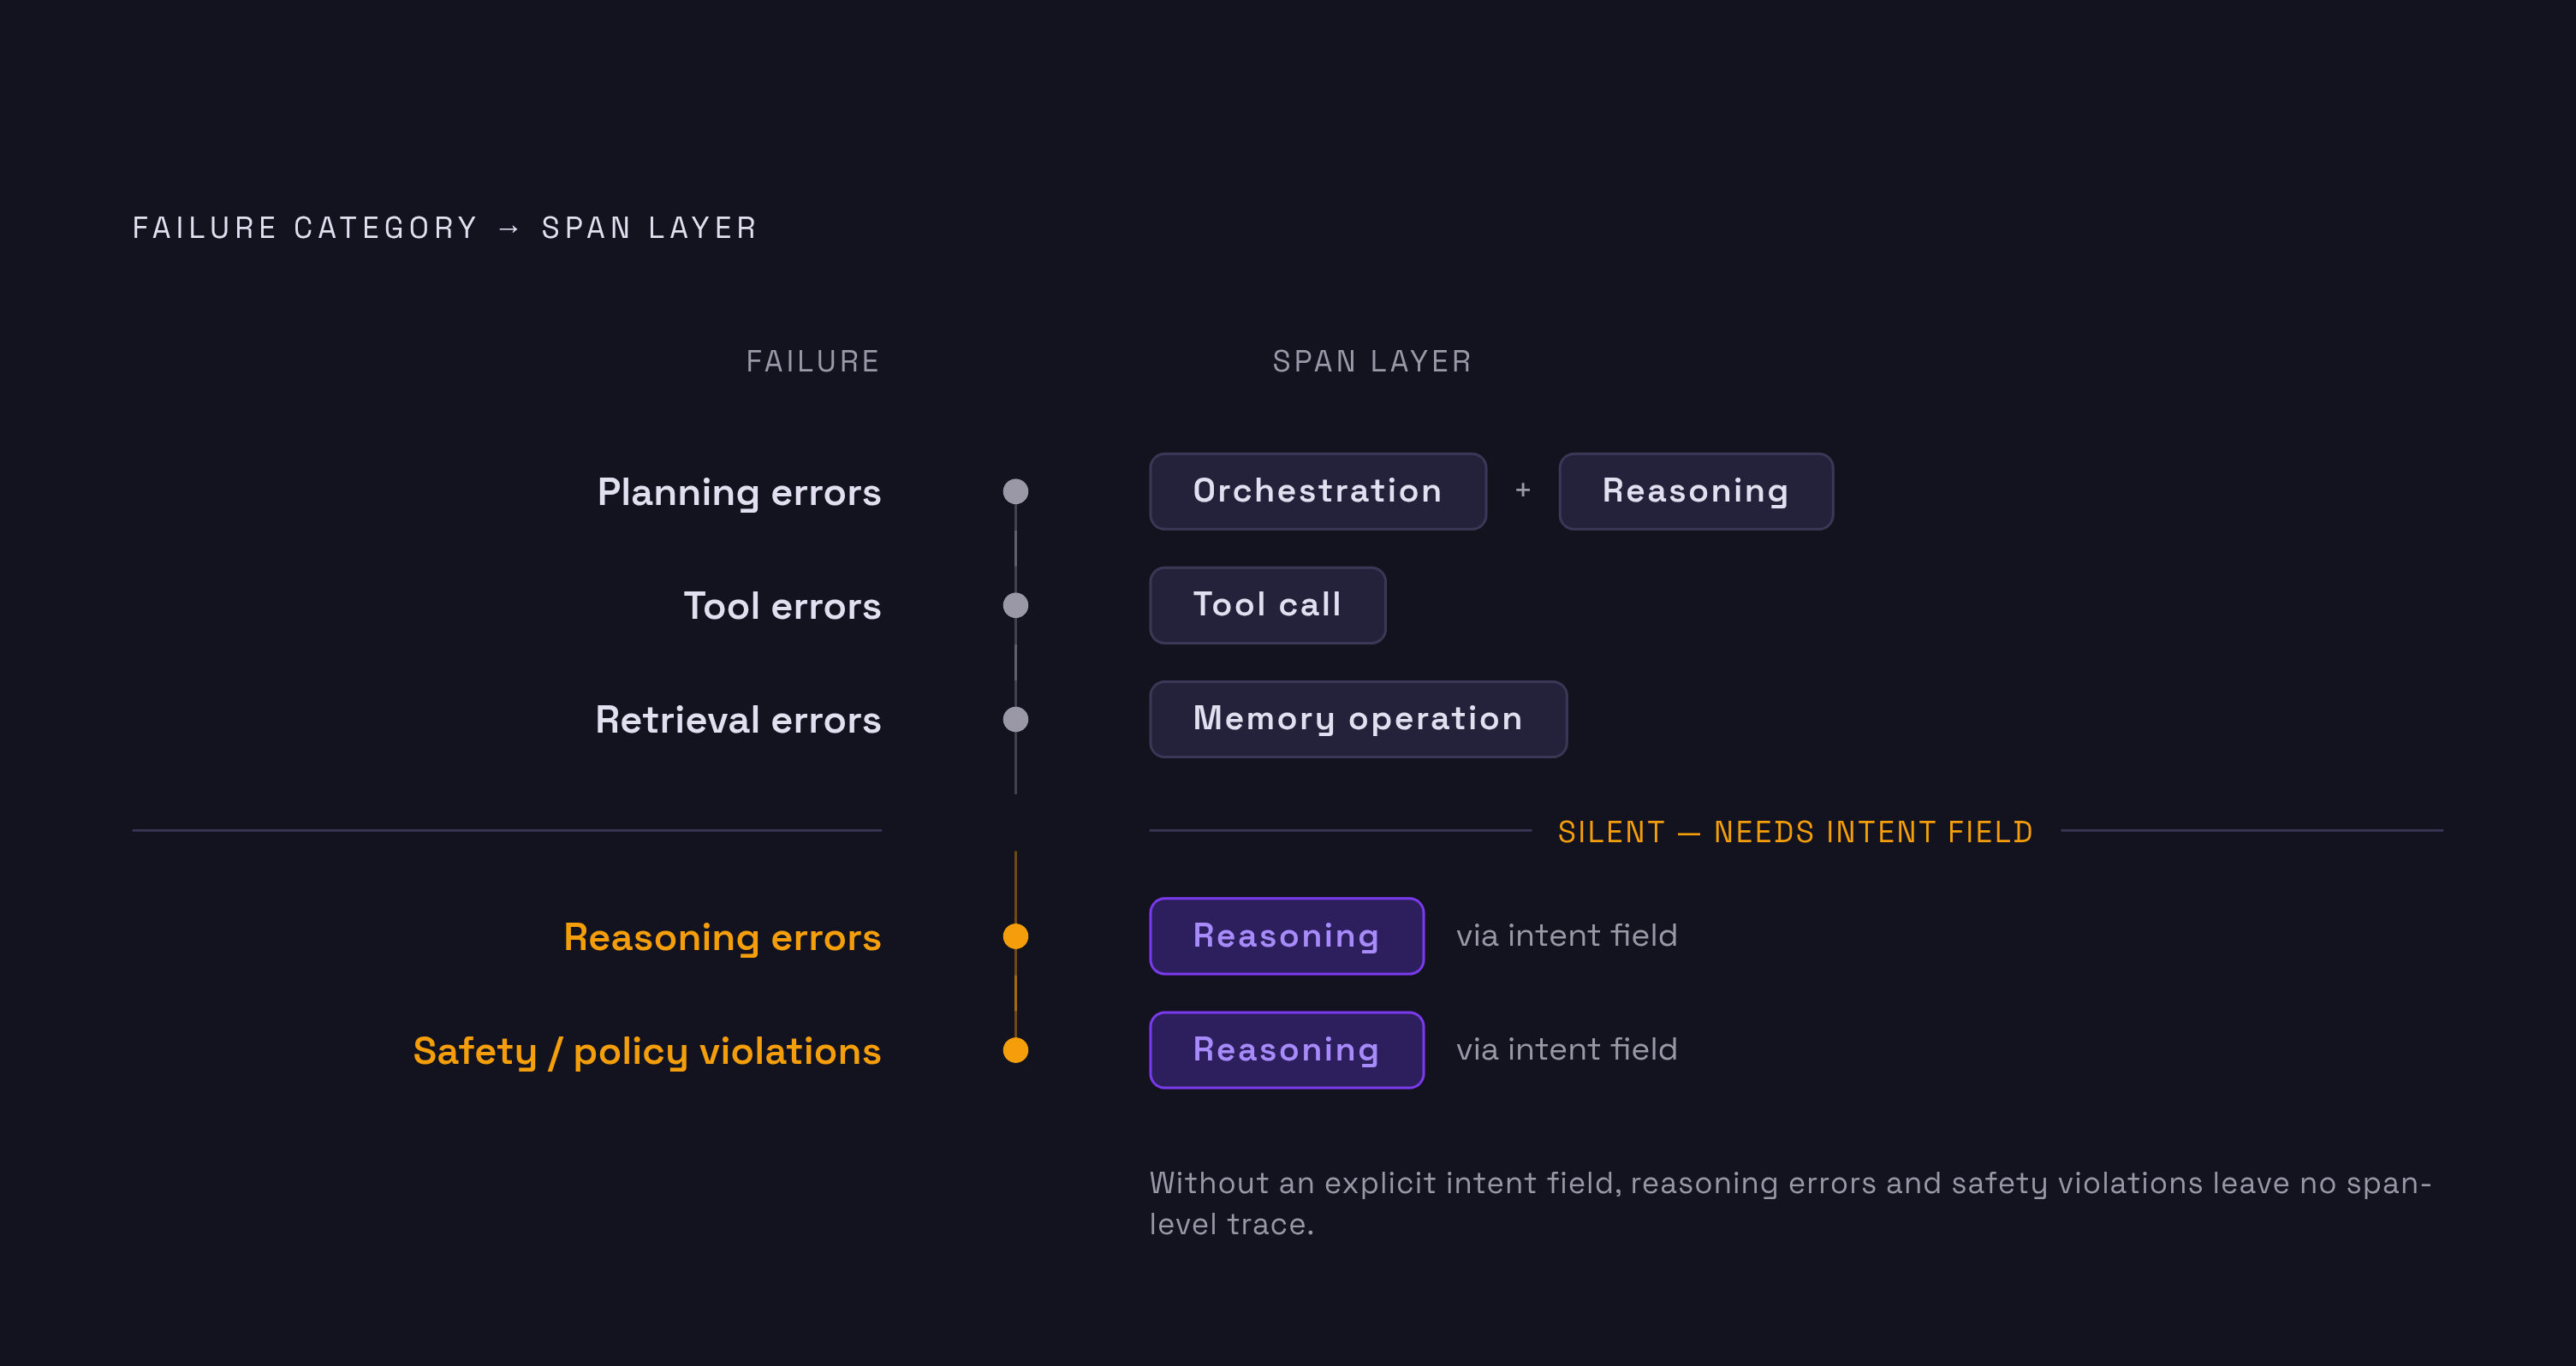
Five categories account for most of the ways production agents fail: planning errors, tool errors, retrieval errors, reasoning errors, and safety or policy violations. Each one leaves a distinct fingerprint at a different layer of the span hierarchy, and designing spans to expose that fingerprint is what separates a monitoring system that only pages when an agent crashes from one that catches an agent misbehaving in real time.
Planning errors appear in the orchestration and reasoning spans. An infinite-loop pattern carries its own fingerprint too: the same tool firing repeatedly with similar arguments across consecutive reasoning spans, with no advancement toward the goal state, which requires retry counts and goal-state attributes recorded at the reasoning level to catch.
Tool errors live in the tool call span. A related failure occurs when a tool returns a non-success status and the agent proceeds as though it succeeded anyway, so the span must carry result status explicitly, with a missing or null status field flagged as its own signal.
Retrieval errors live in the memory operation span. The memory span is the only artifact that can disambiguate between those two causes.
Reasoning errors and safety violations require an intent field directly in the reasoning span. A factual error or a policy violation that still returns a success-code response is undetectable at the span level unless a field records what the agent was supposed to do at that step, because the deviation only becomes visible when the output is compared against that declared intent. Conventional spans cannot answer whether a tool call matched the agent's plan or whether a result advanced the declared goal, which is the exact distinction that separates a planning error from a reasoning error, and observability built on intent-aware tracing is how teams surface that distinction automatically instead of pulling failing conversations into Slack to guess at the root cause.
Propagating trace context across agent boundaries and tool calls
The hardest span design problems in production don't occur inside a single agent. They occur at the boundaries: handoffs between agents, tool calls into external services, and memory reads that cross session lines. A broken trace ID at any of these points severs the causal chain and makes what is actually a systemic failure look like an isolated incident.
Multi-agent handoff instrumentation requires the handoff payload to be recorded as a span on the parent agent's trace, the receiving agent's run to be nested under that handoff span, and the same trace ID to flow through both sides. Inter-agent trust escalation, where a compromised agent asserts a false identity or inflated permissions to an orchestrator, is only detectable if the handoff span records both the claimed identity and the actual source of the request; a span that records only the destination misses the assertion.
MCP and plugin boundaries carry their own propagation requirement. With MCP established as the standard for connecting models to external tools, a trace that starts in the host application has to propagate through the MCP client SDK, the MCP server, and any downstream services as a single unified span tree. A break anywhere in that chain produces a span that looks like an ordinary tool execution with no visible cause, which is arguably worse than no span at all, since it gives a false impression of completeness.
The entropy principle research documented a related class of failure directly: inter-agent transmission failures, where one agent fails to pass critical context to another, occurred without error messages, timeouts, or resource bottlenecks of any kind. The countermeasure is a memory operation span that carries a session-of-origin attribute alongside the document ID, so a later failure can be traced back to the session where the bad entry was written.
Sampling strategies that preserve intent signals without drowning in volume
Intent-aware spans generate substantially more telemetry than conventional spans do: a single user request can trigger multiple LLM calls, several tool executions, one or more memory retrievals, and several planning steps, each producing its own span, which multiplies volume fast. Production agents generate far more telemetry than traditional REST APIs handling an equivalent volume of requests, and full-fidelity collection of every span at production scale becomes economically unworkable fast.
The naive response is to thin the spans themselves to cut volume, which undoes what building them this way was supposed to achieve. A reasoning span that drops its goal-state attribute to save bytes is no longer an intent-aware span. It's a conventional span with extra steps attached to it, and it loses the exact signal the rest of this design exists to preserve.
The workable alternative is sampling applied at the level of the trace, not the individual span. The sampling decision has to propagate through the whole trace: if the session span gets sampled, every child span beneath it, reasoning, tool, memory, needs to be sampled at that same rate, because a partial trace destroys the parent-child relationships that make intent visible.
One risk remains even with this approach. The countermeasure is anomaly-triggered full-fidelity capture: any trace where a span's attributes deviate from the baseline distribution for that agent and that step type gets promoted to full capture, regardless of whatever sampling rate would otherwise apply to it.
Turning production traces into regression baselines
When spans are structured this way, carrying intent alongside execution with clear parent-child relationships between reasoning steps and the actions they trigger, every deviation from the agent's own instructions becomes traceable at the step level, and that structure is what the production monitoring layer relies on to surface silent failures as they happen, before they reach a support queue.
A conventional trace cannot tell a team whether what the agent did was actually correct. Recording only execution mechanics means a human reviewer has to reconstruct the agent's intent manually before the trace can become anything more than a record of what happened. The trace, structured this way, is its own label.
That property is what makes an eval-observability workflow possible: production failures become eval cases automatically, those eval datasets become regression baselines for the next deployment, and a GitHub Action can run evals against every pull request and block a merge when a change degrades agent quality relative to those baselines. Span design, understood this way, is the foundation a team stands on to know that the next deploy is safer than the last one.
Where Lemma fits in this instrumentation layer
The span design patterns laid out across this piece, intent fields in reasoning spans, goal-state attributes, failure-category tags, and the trace-to-eval workflow, all depend on a layer capable of auditing those spans against an agent's own instructions without requiring a team to predefine every failure mode it might encounter in advance. A team can design the right spans, propagate trace context cleanly across agent boundaries, and sample intelligently, but it still has no automated way to score whether a given reasoning span's declared intent actually matched what the agent did. That comparison requires understanding the agent's instructions, not just reading its outputs after the fact.
Lemma occupies exactly that layer: it audits every trace against an agent's own instructions and groups recurring failures into issues automatically, sitting between a well-instrumented span and a silent failure that would otherwise surface only as a user complaint. The founding team came out of Y Combinator's Fall 2025 batch, and they built the platform specifically for the production reliability problems this piece has worked through, rather than adapting it from general-purpose APM tooling built for a different kind of system.