Tracing OpenAI Agents SDK Tool Calls and Handoffs
How to inspect agent decisions, tool calls, and handoffs through the SDK's trace hierarchy.
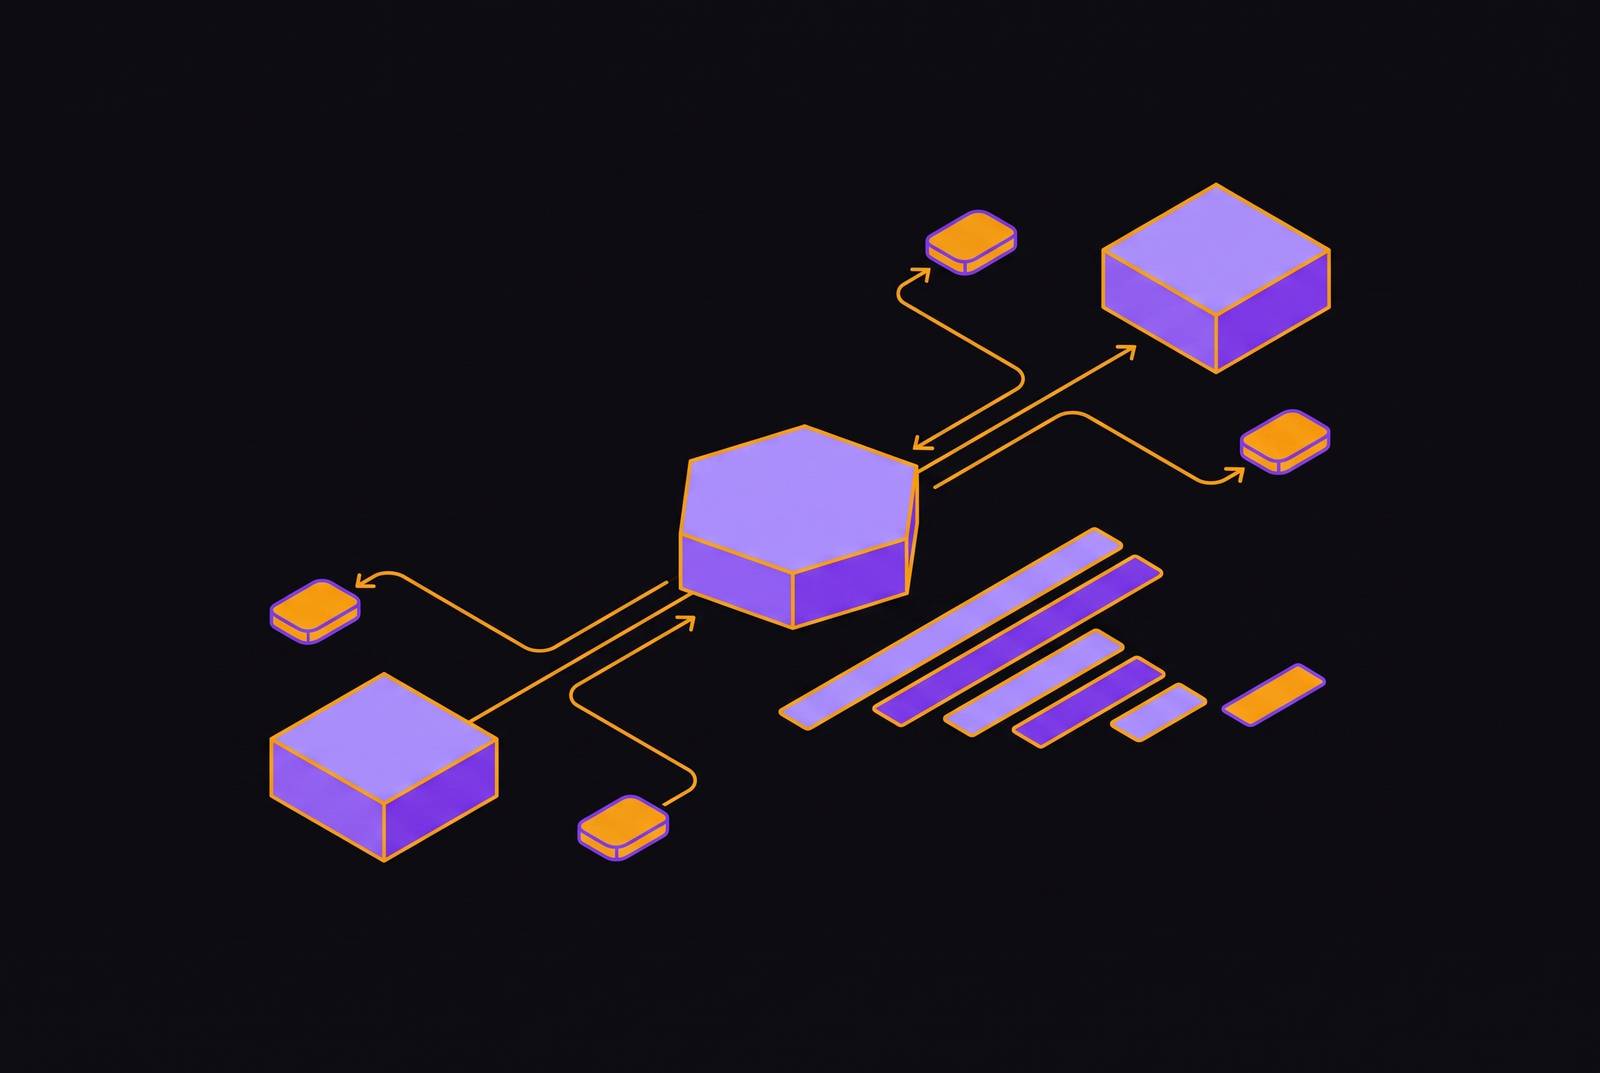
The OpenAI Agents SDK is a production framework built around four primitives: agents, tools, handoffs, and guardrails. Tracing is the surface that makes all four primitives inspectable, and the SDK ships it as a first-class part of the architecture because the behavior it enables would otherwise be invisible. An agent decides, at each turn, whether to call a tool, hand control to another agent, or produce a final answer, and none of those decisions show up in application logs the way a normal function call does. Once you accept that an agent's control flow is a decision process rather than a fixed call sequence, tracing stops looking like diagnostic tooling and starts looking like the only record of what the system actually did.
The span hierarchy the SDK creates by default
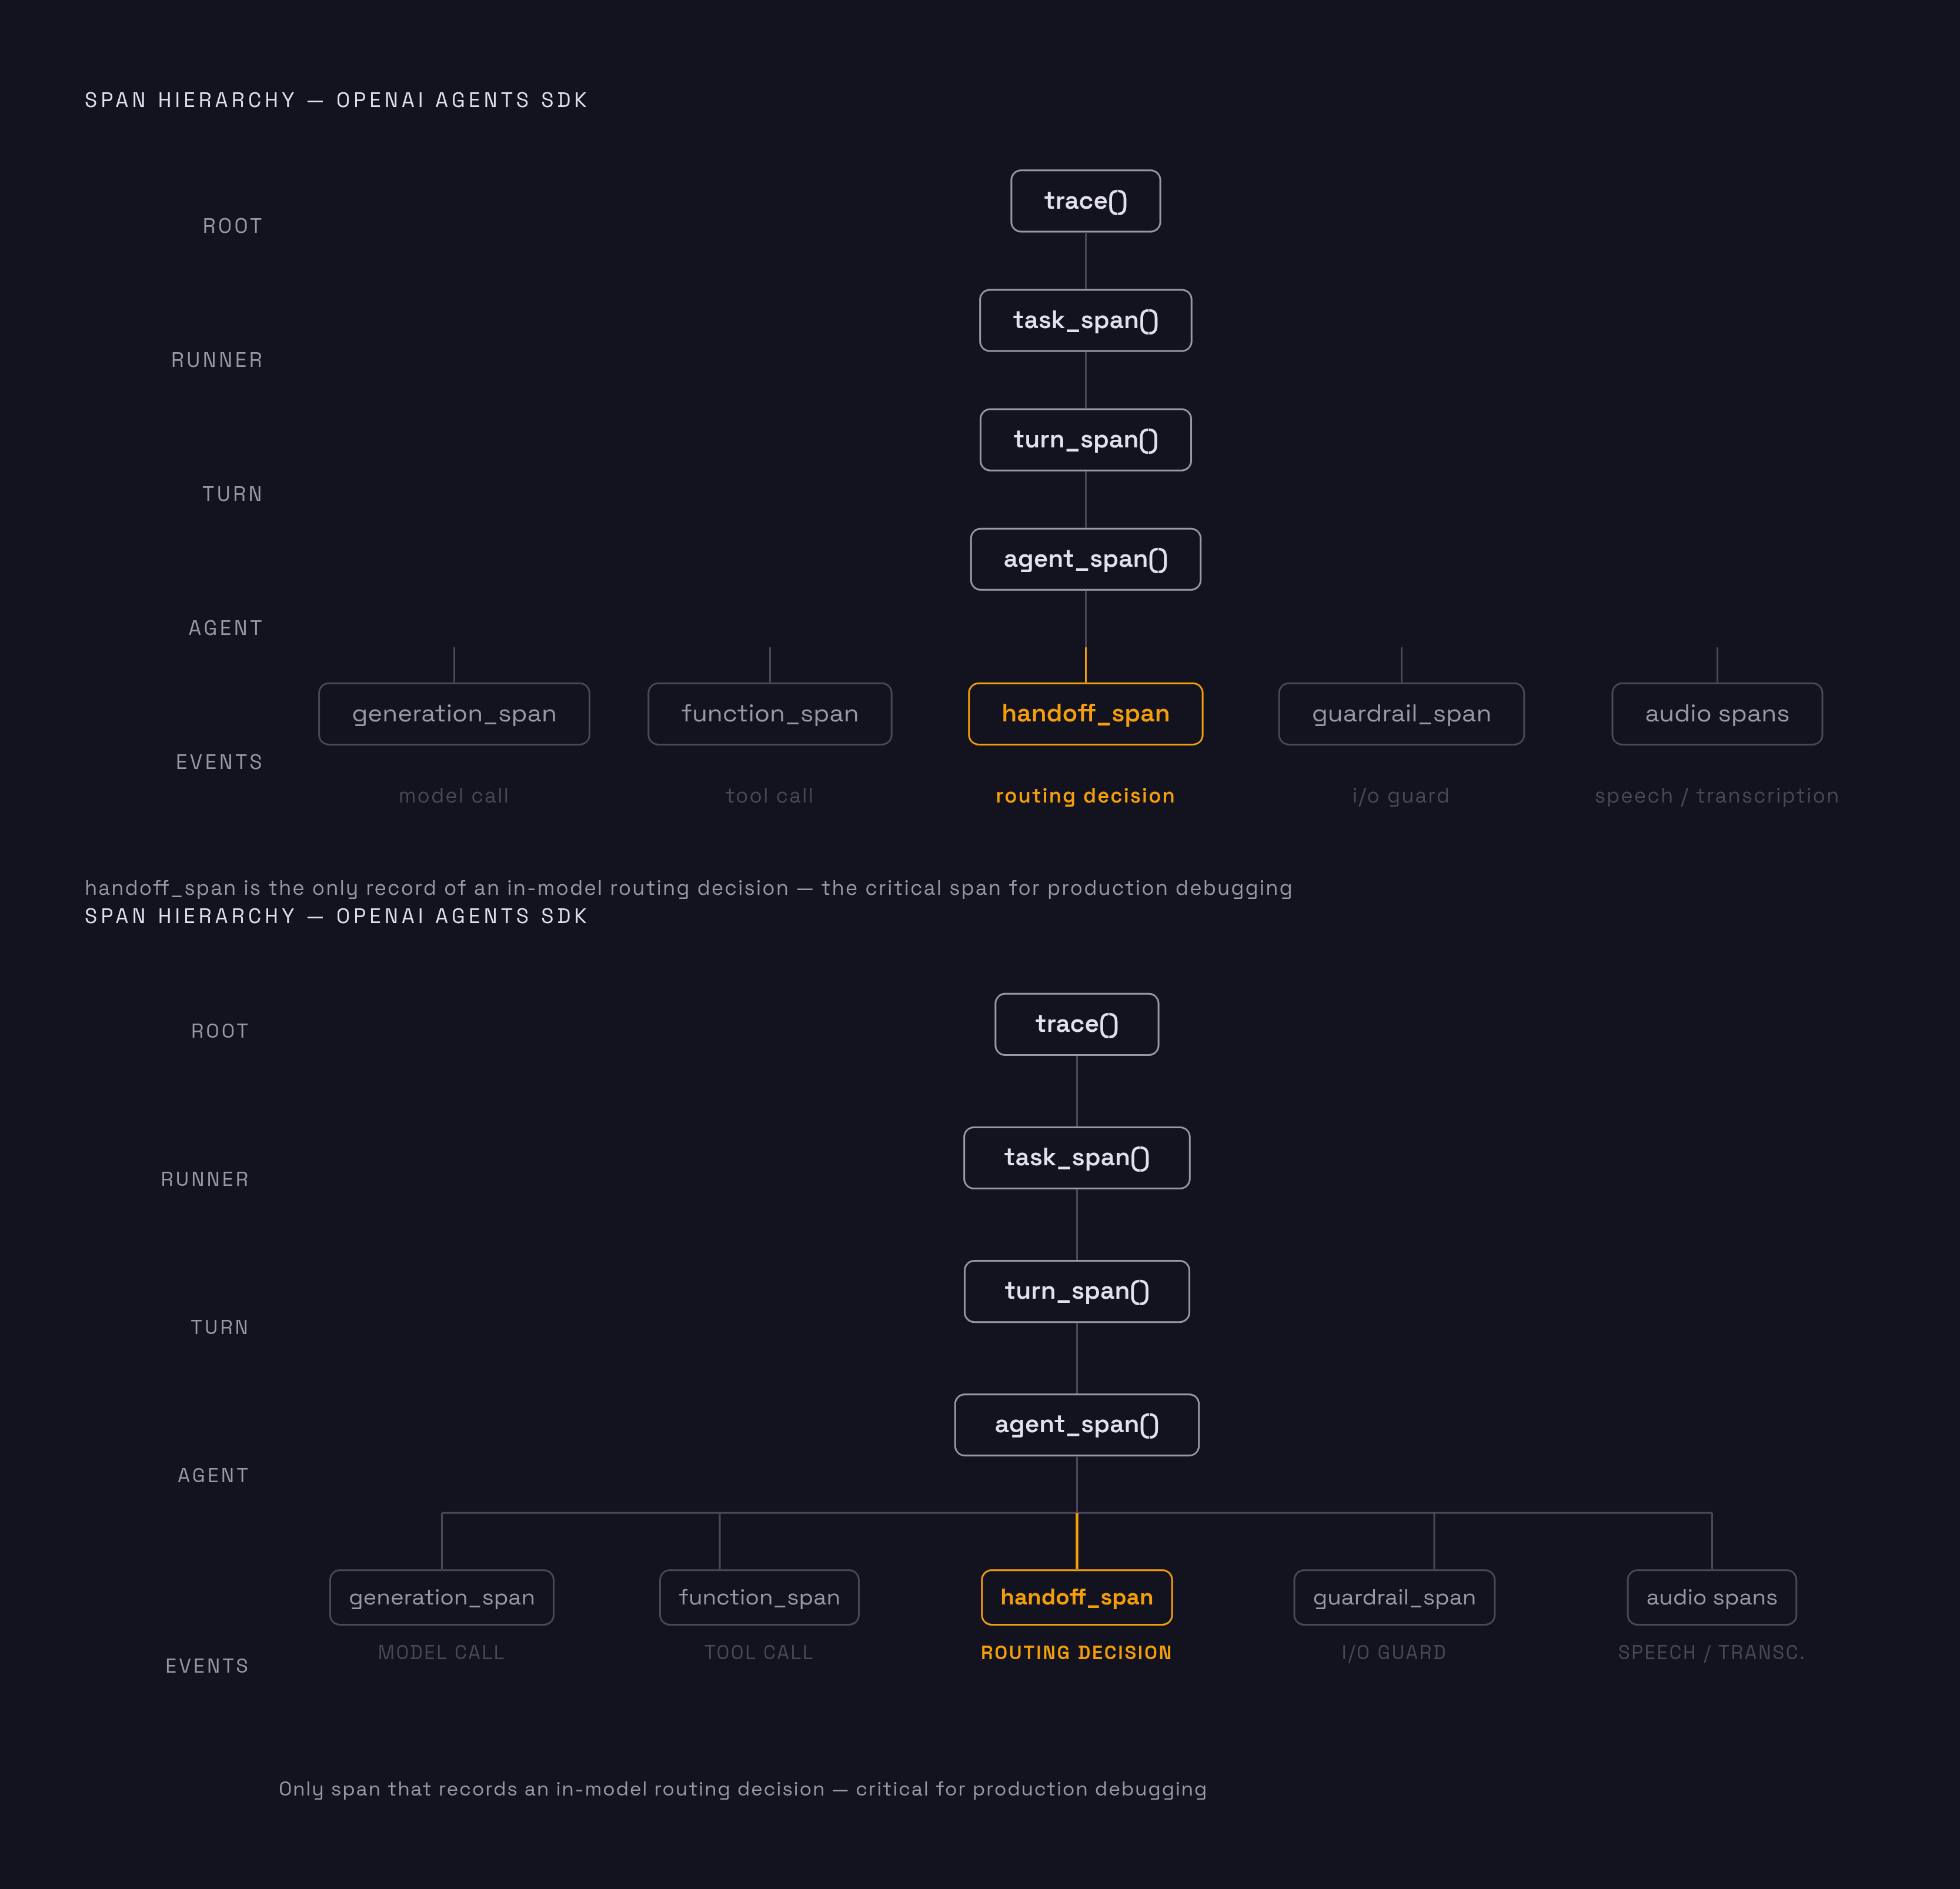
Every call to Runner.run builds a deterministic tree of spans, and reading that tree is the starting point for debugging anything an agent does. At the top sits the trace(), wrapping the full run. Inside it, the SDK nests a task_span() for each runner invocation, a turn_span() for each pass through the model loop, and an agent_span() each time a given agent becomes active. Below those structural layers sit the event-level spans that carry the actual content of the run:
| Span type | Fires on | Records | |---|---|---| | generation_span() | each model call | model identity, recorded input and output, token usage when available | | function_span() | each tool invocation | tool name, arguments passed, return value | | handoff_span() | each agent-to-agent transfer | source agent and destination agent | | guardrail_span() | each input or output guardrail | guardrail name, whether it tripped | | transcription_span() / speech_span() | audio input/output, optionally grouped under speech_group_span() | audio-specific run data |
Three fields let a trace be identified and connected to others: workflow_name (which defaults to "Agent workflow"), a trace_id (generated automatically if none is supplied), and an optional group_id that links the traces belonging to a single multi-turn conversation, a chat thread ID being the common case. By default, the SDK records the actual inputs and outputs passed to models and tools. Teams that want a leaner hierarchy can also suppress the task and turn spans through RunConfig(tracing={"include_task_and_turn_spans": False}), which leaves the agent, generation, function, guardrail, and handoff spans recording as usual.
Why the handoff span is where routing failures hide
A handoff looks nothing like a function call that returns a value. The SDK gives the model a hidden tool for each potential destination agent (something like transfer_to_billing_agent), and when the model calls that tool, the runner swaps the active agent and replays the entire conversation history into it. From there, the billing agent takes over the conversation as if it had been running the whole time, with its own agent and generation spans nested beneath it in the trace tree.
Because the model, not a developer's branching logic, makes this call, the only place the correctness of that decision becomes visible is the handoff span itself. A support ticket doesn't fail loudly; it just gets routed badly, and the handoff span is the only record that shows which agent was active, what it was handed, and where it went next. That invisibility is precisely why tracing matters at the architectural level, not just the debugging level: control flow that lives inside a model's decision cannot be verified any other way. In production, seeing that a handoff fired is not the same as knowing it fired correctly, and that gap is where Lemma's approach to monitoring applies: it checks each agent decision against the agent's own instructions and surfaces deviations automatically, catching the kind of silent routing failure that no error code would ever flag.
An agent used as a tool via .as_tool() runs the inner agent to completion, and its output comes back as the result of a function_span, with the inner agent's full span subtree nested inside that function span. Reading a trace correctly means knowing which of these two shapes you're looking at before drawing conclusions about where an agent handed off control. Multi-turn conversations add one more requirement: without a group_id tying separate Runner.run calls together, each turn appears as its own isolated trace, and analyzing routing behavior across a conversation becomes impossible.
What the OpenAI Traces dashboard shows
The Traces dashboard does its job well for a single run. You can open a trace, walk its span tree, check timing on each step, and read the recorded inputs and outputs for every model call and tool invocation. For debugging a specific failure a developer just reproduced, or for understanding how a new agent behaves during development, that's the right tool and it's enough.
The dashboard's usefulness changes shape once the question moves from "what happened in this one run" to "what is happening across thousands of runs." Nothing in the dashboard answers how often the triage agent skips a handoff it should have made, which customers are driving a disproportionate share of token spend, which tools fail repeatedly and whether that failure rate is rising, or whether a handoff fired without any subsequent tool call, which would suggest the destination agent stalled after taking over. These are aggregate questions, and the dashboard is built around individual traces, not populations of them. For organizations operating under a Zero Data Retention (ZDR) policy, the dashboard offers nothing at all, since tracing itself is unavailable under that policy. For those teams, routing spans somewhere external is the only way to get any visibility whatsoever.
Routing spans to an external backend with trace processors
The SDK's processor interface is the seam where the built-in tracer meets any external backend, and using it requires no change to how agents, tools, or handoffs are written. Under the hood, the SDK maintains a TraceProvider that holds a list of processors, and each processor receives the same lifecycle events: a trace starting, a span starting, a span ending, a trace ending. Adding a destination means adding a processor to that list, not rewriting agent logic.
Two calls control how processors are configured. add_trace_processor(my_processor) keeps OpenAI's own export running and adds a second destination alongside it, so nothing already working in the dashboard breaks. set_trace_processors([my_processor]) replaces the default processor list outright, which is the right call when an organization wants data going to one place only, under ZDR constraints or otherwise. None of this is backend-specific. Any observability tool that can accept span data in a structured format can sit behind this interface, so the choice of backend stays a separate decision from the choice to export.
Grouping multi-turn conversations and handling export timing in long-running workers
How conversations get grouped and when spans actually leave the process are the two configuration decisions that make exported trace data usable once it reaches an external backend. Get either one wrong and the data arrives incomplete or scattered in ways that make later analysis harder than it needs to be.
Grouping comes first. Wrapping several Runner.run calls inside a with trace("Workflow name"): block groups them under a single trace, which is the simplest way to keep a multi-step workflow together. For a multi-turn chat thread, that group_id should map to something stable, a thread ID or conversation ID, so that turns taken minutes or hours apart still tie back to the same conversation.
Timing is the second decision, and it catches teams running agents inside background workers more often than teams running them in a request-response loop. The default BatchTraceProcessor doesn't export spans the instant they're created. In Celery, RQ, Dramatiq, or FastAPI background tasks, a job can finish and the worker can move on to its next task before the batch processor has actually sent the spans out. A trace can therefore be missing from the dashboard or from an external backend even though the run completed successfully. The fix is to call flush_traces() after the trace() context has closed, not inside it. Calling flush_traces() will still push that buffered data out.
Exporting traces to an OpenTelemetry backend: what a handoff and sub-agent look like in exported data
An exported trace is only as good as the attributes attached to each span, and that conversion work is the processor's actual job: taking the SDK's internal span representation and turning it into fields an external backend can filter, group, and query. A processor built for OpenTelemetry takes each SDK span and adds the attributes a backend's UI reads directly: span type, the recorded input and output, which model handled a generation, token counts where they're available. That data goes out over OTLP, and when the processor was added with add_trace_processor rather than set_trace_processors, OpenAI's own dashboard keeps getting its copy of the same trace in parallel.
Laminar offers one concrete example of how this wiring works in practice. Laminar is one option among several that can sit behind the processor interface; the integration pattern, not the specific vendor, is what matters for understanding the export mechanism.
A handoff and a sub-agent call produce structurally distinct data in that export. A handoff produces a handoff_span whose attributes carry the source agent's name and the destination agent's name, and the agent_span for the destination agent that follows sits as a sibling of that handoff span, both parented under the original agent's context. Read as a tree, the routing path is legible: triage agent, handoff span, billing agent, all in sequence. An agent called as a tool through .as_tool() produces something different: a function_span at the level of the outer agent, with the inner agent's entire span subtree, its own agent and generation spans, nested inside that single function span. Control never left the outer agent's trace context. A query needs to get that structural difference right if it's trying to count how often a given agent handed off control versus how often it merely delegated a sub-task and kept running.
What cross-run production queries the exported traces enable
Getting spans into a queryable backend turns per-run inspection into population-level analysis, and that shift is what makes several production questions answerable for the first time. Handoff skip rate becomes a query: how many runs show a triage agent completing without a handoff_span ever firing, across a given time window. Tool failure rate becomes a query: how often does a function_span's return value match an error pattern, broken down by tool name, and is that rate moving week over week. Per-customer spend becomes a query: summing token usage drawn from generation_span attributes, joined against a session ID or user ID passed through trace metadata. Latency outliers become a query: looking at the distribution of agent_span durations and flagging runs where one agent took far longer than its typical range.
All of these queries share a dependency that's easy to miss: they only catch failures that leave a structural fingerprint in the spans themselves. An agent that calls the right tool with plausible-looking arguments but fabricates the return value produces a function_span that looks completely normal. A support agent that tells users a cancellation policy exists when no such policy was ever written into its instructions will generate perfectly well-formed traces, every span firing in the right order, right up until those traces, in aggregate, represent a pattern of customers being told something false. Structural tracing answers whether the right spans fired in the right sequence. It has no way to answer whether what the agent said or did was actually true to its instructions.
Monitoring semantic failures against the agent's own instructions
Knowing what an agent did is not the same as knowing whether what it did matched what it was supposed to do, and no amount of span inspection closes that gap on its own. The generation span looks normal, the tool returns a value without error, the handoff fires cleanly, and somewhere inside that unremarkable-looking sequence the agent has fabricated an order number, promised a refund its instructions never authorized, or routed a customer based on a criterion it was explicitly told not to use. None of that registers as a span anomaly, because nothing about the span's structure is wrong. The failure lives in the content, not the shape.
Traditional error monitoring and a well-configured OpenTelemetry backend both evaluate structure rather than meaning, so neither is built to catch this. There is no span attribute that captures "this return value contradicts the agent's instructions," because that judgment requires comparing the agent's actual behavior against the specific instructions it was given, case by case, not against a predefined list of failure modes someone wrote down in advance. Asking a team to enumerate every way an agent might misbehave before deployment is both unrealistic and, even where attempted, incomplete. This is the layer Lemma operates at: it audits traces against the agent's own instructions and groups recurring deviations into issues, which turns a pattern like a fabricated policy showing up across dozens of conversations into a single flagged issue rather than dozens of unrelated, unnoticed incidents.
For a team shipping on the OpenAI Agents SDK, the practical path is layered. Configure the span export, assign group_id so conversations correlate properly across turns, and route spans to a queryable backend for the structural questions, handoff rates, tool failures, latency, spend. Treat semantic monitoring, auditing what the agent actually said and did against what its instructions told it to do, as the layer built on top of that structural foundation, not a substitute for it. Span export tells you the machinery ran. Semantic monitoring tells you whether it did the job it was supposed to do, and production reliability depends on having both.