Propagating Trace Context Across Async Agent Tool Calls
Three structural breaks in async agent tracing each demand their own fix.

Async agent tool calls break trace context in three structural ways, and each one has a concrete fix at the instrumentation layer. Message queues don't carry HTTP headers, framework loops hide their internal spans, and concurrent tool calls overwrite each other's parent context. The result is a backend full of orphaned roots and trace ID discontinuities that no amount of configuration tuning will resolve.
Why async agent tool calls break trace context in ways HTTP-based tracing was never designed to handle
The W3C Trace Context specification was built around a model that fits synchronous request-response flows most naturally: context travels in HTTP headers at each service hop. The spec does not restrict itself to synchronous calls only, but the propagation mechanisms it standardized assumed a world where a request carries its tracing metadata through headers from one service to the next. Agentic architectures violate that assumption at the most fundamental level. An orchestrator spins up worker agents through a message queue, a framework runs an internal decision loop that never crosses a network boundary, and a fan-out of concurrent tool calls shares process memory in ways that a header-based model simply never anticipated.
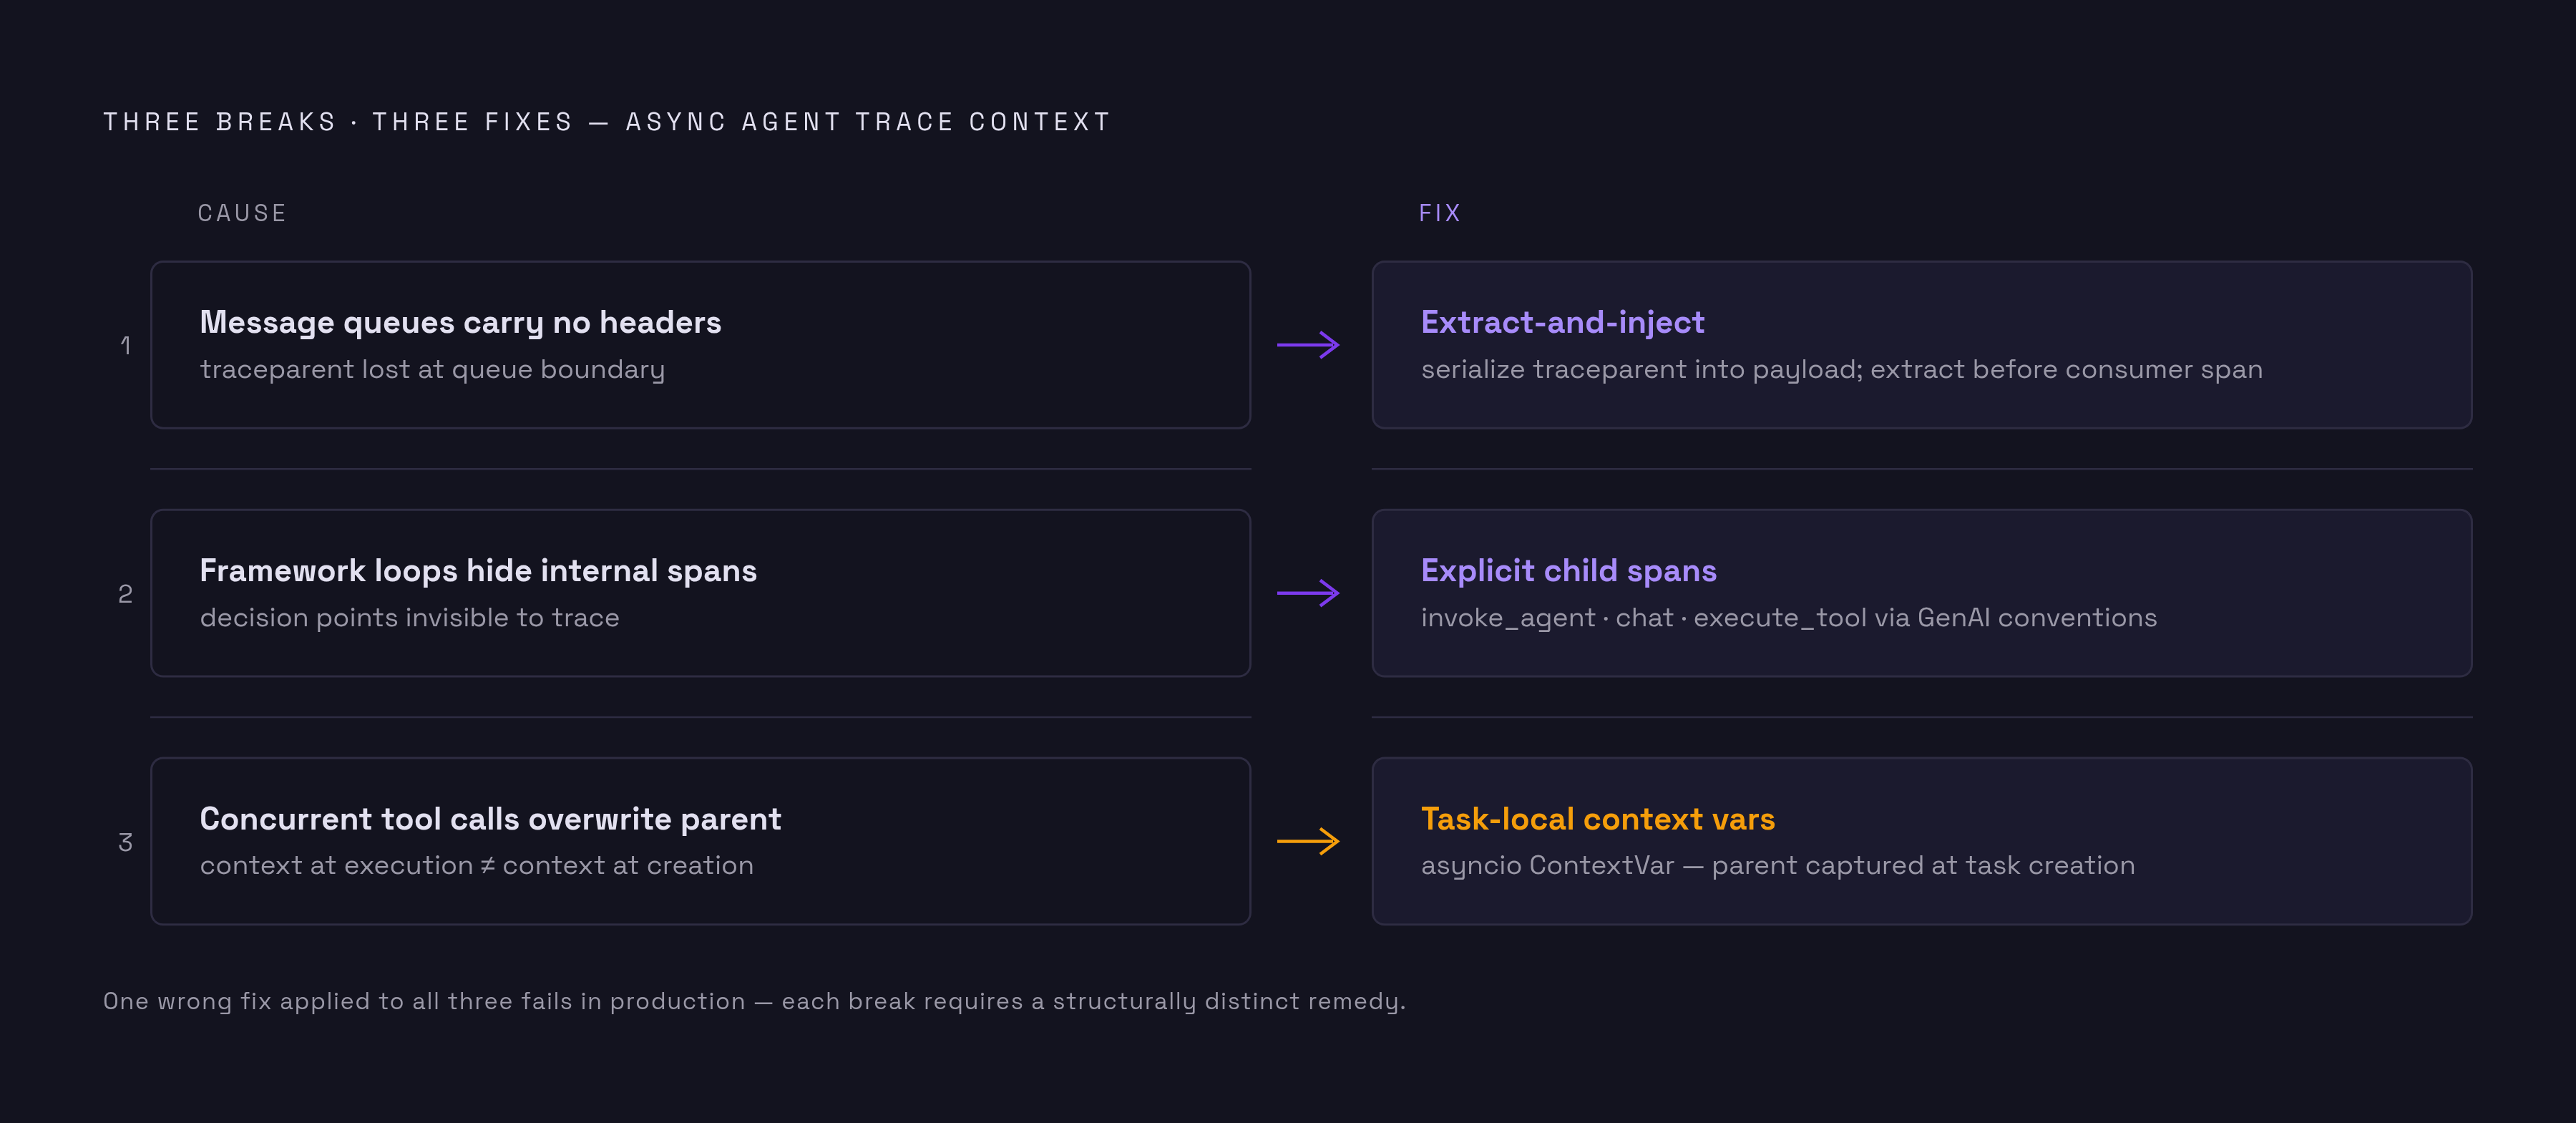
These are not configuration mistakes. They are structural mismatches between two execution models, and the diagnostic signature of the mismatch appears in any tracing backend in four distinct forms: root spans with no parent that appear mid-sequence, trace ID discontinuities between the orchestrator and worker, tool-call spans appearing as roots instead of children of LLM spans, and timing gaps with no explaining spans between orchestrator and worker. Three structural causes account for the majority of broken traces in production agentic systems. Message queues carry no headers. Agent frameworks hide internal spans. Concurrent tool calls corrupt parent-child relationships. Each is a distinct failure mode with a different fix, and treating them as one undifferentiated propagation problem leads engineers to apply the wrong remedy to the wrong break.
How message queues sever the causal chain and how to reattach it with explicit extract-and-inject
When an orchestrator agent enqueues work for a worker agent, there is no HTTP request to carry the traceparent header. The worker creates its own root span, and the tracing backend shows two separate traces for what is logically one operation. The orchestrator's trace ends at the enqueue call. The worker's trace begins with a root span that has no parent, and the causal relationship between the two disappears entirely. For a multi-agent system where the orchestrator makes a decision and delegates execution, this severs the chain at precisely the point where the interesting work begins.
The fix is the extract-and-inject pattern, and its core insight is that traceparent is just a string. It can travel through any medium as long as it is written on the sender side and read on the receiver side. The sequence of operations is specific. Before enqueuing, capture the active span context. Serialize it into a carrier dictionary using the propagator. Store that dictionary alongside the message payload. On the consumer side, extract the context from the carrier before creating any new spans. This pattern applies to message queues, job queues, and any async handoff where HTTP headers are not automatically available. The traceparent string written into a message body, a database row, or a Redis key performs exactly the same function as the HTTP header it would have occupied in a synchronous system.
W3C Baggage is the underused companion to traceparent, and it matters for reasons beyond trace identity. TraceContext propagates the trace ID and span ID. Baggage propagates arbitrary key-value pairs, such as user ID and session ID, that follow automatically across all descendant spans without you threading values through every function parameter. In a multi-agent system the orchestrator knows who the user is, but specialist agents do not. Setting the session ID in Baggage at the entry point means every downstream span, the LLM call, the tool invocation, the vector database query, carries it automatically. Observability tools built for agentic systems rely on this metadata to correlate which user experienced which failure and to group failure patterns that would otherwise appear unrelated across a distributed system. A practical test heuristic follows from the severity of this failure mode: propagate trace context across the slowest, most asynchronous code path first. If it survives a message queue hop, it will survive everywhere else.
How the MCP specification now mandates trace context propagation and what that means for instrumentation
Message queues are a general problem, but the Model Context Protocol introduces a specific trust-boundary variation of it. When an agent invoked an MCP server historically, the protocol did not automatically receive and propagate traceparent headers from the calling agent. Each MCP server operation appeared as an isolated root span, with no link to the agent that initiated it. The 2026-07-28 MCP specification addresses this directly by documenting W3C Trace Context propagation inside MCP request metadata, fixing the key names traceparent, tracestate, and baggage. When an AI host or orchestrator initiates a tool call, it SHOULD inject tracing metadata into the JSON-RPC request body inside the _meta object. The specification reserves these keys and requires that their values follow W3C Trace Context and W3C Baggage formats when present, though it imposes no MUST obligation on hosts to inject them.
The choice of params._meta as the injection point was deliberate. Injecting at the transport layer was considered but rejected, because MCP spans stdio and streamable HTTP transports, and params._meta is transport-agnostic, sitting at the single chokepoint in the tool invocation path. Several SDKs were already doing this informally before the specification landed. Pinning the key names means a trace that starts in a host application can follow a tool call through the client SDK, the MCP server, and whatever that server calls downstream, and arrive in an OpenTelemetry backend as one span tree. OpenTelemetry v1.39 added MCP semantic conventions alongside this, with attributes including mcp.method.name, mcp.session.id, and mcp.protocol.version. The key design decision in those conventions is conditional: when MCP instrumentation can reliably detect that outer GenAI instrumentation is already tracking a tool execution, it SHOULD NOT create a separate span and SHOULD instead enrich the existing execute_tool span with MCP attributes. SDKs may require a configuration option to enable this behavior. When it is enabled, an agent calling ten MCP servers can be traced as cleanly as one calling a single local function, and that coherent sequence is what allows monitoring layers to correlate agent behavior across trust boundaries and catch failures spanning multiple services.
How opaque framework loops hide internal spans and how to surface them with explicit instrumentation hooks
The second structural failure mode produces a different diagnostic signature and demands a different fix. Agent frameworks that run tool loops internally, making LLM calls and tool invocations without exposing instrumentation hooks, produce one top-level span for the entire execution. Everything that happened inside is invisible: which LLM call was slow, which tool returned a malformed response, which retry finally succeeded. Where the queue problem manifests as orphaned root spans, this problem manifests as a single wide span with suspiciously long duration. The framework absorbed the causal structure into an opaque block. The fix is not extract-and-inject. It is adding child spans at the framework's internal decision points, the thought, the tool selection, the tool execution, the response formatting, either by wrapping framework callbacks or using the framework's own instrumentation hooks where they exist.
OpenTelemetry's GenAI semantic conventions define the standard names for the spans that should exist inside this loop: an invoke_agent span at the top, chat spans for model calls, and execute_tool spans for tool calls carrying token counts and finish reasons. They are still marked Development as of mid-2026, so attribute names can shift, but the major backends already read them. Two histogram metrics form the floor for any production deployment. gen_ai.client.operation.duration captures latency, and gen_ai.client.token.usage captures tokens broken down by input and output. Without these, teams cannot reason about cost or loop behavior inside the framework's execution. The opaque loop hides precisely the information that distinguishes a healthy agent from one that burns its entire budget on a single malformed tool response.
How concurrent tool calls corrupt parent-child relationships and how Python's context variables prevent it
The third failure mode is different in kind from the first two. When an agent fans out to multiple tools concurrently, the wrong instrumentation structure makes one concurrent tool the parent of another, or causes a nested agent to appear as an unrelated root. The problem is not in the execution graph. It is in how the tracing library stores the current span. The core rule is that the parent is the operation that caused the work, not whichever span happened to start most recently in the process. In synchronous code a process-wide stack works because only one span is active at a time. In async code, concurrent tasks share that stack and overwrite each other's active context.
Python's context variables provide the fix because they are task-local rather than process-local. The operative move in an asyncio pattern is to create all concurrent tasks while the parent span is still current, so that each task inherits the correct parent at creation time. Each task then runs in its own context, and the spans it creates attach to that parent regardless of when they actually execute. When the instrumentation wraps a tool invocation in a task that captures the current context at creation, the parent-child relationships in the backend reflect the causal structure of the fan-out: one parent agent span, with sibling execute_tool spans beneath it. The fix is not extract-and-inject, because nothing is being written to a queue or a message body. It is task-local context rather than process-wide state, and it corrects a corruption pattern that no amount of propagation code would address.
How to verify that context is actually propagating end-to-end, and what broken propagation looks like in a backend
Knowing how to fix broken propagation is not enough if teams cannot tell whether the fix is holding in production. Verification requires knowing what a correctly connected trace looks like and what the specific signatures of each remaining break look like. Correct propagation produces one connected span tree. The trace ID is consistent from the entry point through every queue hop, MCP call, and concurrent tool. Every tool-call span has a parent LLM span. Every LLM span has a parent agent span. No root spans appear mid-sequence. When a break remains, its signature is specific. Root spans with parent_span_id set to null that appear after the trace's start time indicate a missed extract-and-inject at a queue or MCP boundary. A trace ID change between the orchestrator and a worker indicates the worker created a new trace root instead of continuing the original. Tool-call spans appearing as roots indicate the framework's internal context was not propagated to the tool layer. Timing gaps between spans with no explaining spans indicate queue transit time that context did not survive. One concurrent tool span appearing as the parent of another sibling indicates the process-wide context stack was used instead of task-local context.
The practical verification sequence follows the same order as the failure modes themselves. Instrument and check the message queue hop first, since it is the slowest and most asynchronous path. If traceparent survives that boundary, the pattern is proven. Then verify MCP calls produce enriched execute_tool spans rather than isolated roots. Then run concurrent tool fan-out and confirm sibling structure in the backend. Each check confirms a different aspect of propagation, and each has a distinct pass condition that can be stated precisely in terms of what appears in the span tree.
Why correct trace context is a prerequisite for catching silent agent failures, not just a debugging convenience
Correct trace context is not primarily a developer-experience improvement. It is the foundation that makes silent agent failures detectable, because failures that produce no exception and no error code are only visible in the causal structure of the trace. Silent failure is the dominant failure mode in production agentic systems. An agent can return a success code while calling the wrong tool, working from stale data, or looping before giving up, and standard error monitoring stays green throughout. The service remains healthy while the work goes wrong. That is the gap that a trace ID continuity problem widens into an unbridgeable divide.
The stakes are concrete. A production agent ran correctly by every individual decision metric for forty-two consecutive days while spending the overwhelming majority of its daily attempt budget on four accounts that no longer existed. The failure only became visible through run-level trace reconstruction, not from error rates or status codes. This is not a retrieval failure or a crash failure. It is a governance failure at the runtime substrate, where the agent's reported state diverges from its actual state and no lower monitoring layer can catch it. Without connected traces, without trace ID continuity across queue hops, MCP boundaries, and concurrent fan-out, the monitoring layer cannot reconstruct the causal chain that distinguishes a plausible-looking wrong answer from a correct one. Orphaned root spans mean the monitoring system sees fragments, not a run. It cannot group deviations into patterns, cannot surface which step in a multi-hop workflow produced the bad output, and cannot distinguish a flaky tool from a systematic reasoning failure. Production monitoring platforms built specifically for AI agents, Lemma among them, which audits traces against agent instructions to surface silent failures that error monitoring cannot see, depend critically on unbroken trace context to detect malformed tool responses, missing prerequisites, and silent retry loops that appear to succeed while leaving data inconsistent. Connected traces are necessary for this work. They are not sufficient on their own. But the propagation effort described here, across queue hops, MCP boundaries, and concurrent fan-out, is what makes it possible for any monitoring layer to see what an agent was supposed to do versus what it did, and that visibility is the precondition for catching silent failures before they compound.